The Windows Crash Reports insight helps you monitor Windows fatal crashes across your environment. It highlights affected computers and changes in crash frequency so teams can spot escalating stability issues such as hardware degradation, driver conflicts, software instability, or configuration inconsistencies and take action before disruptions become widespread.
What is a crash?
LabStats defines a crash as a collection of system events that led up to the computer unexpectantly shutting down or otherwise restarting, such as a blue screen or loss of power. This insight specifically looks at the System Event Viewer log for Critical events with the following IDs and provider pairings:
- 1001:Microsoft-Windows-WER-SystemErrorReportingorBugCheck
- 1,18:Microsoft-Windows-WHEA-Logger
- 41,86,88:Microsoft-Windows-Kernel-Power
- 6008:EventLog
Information contained in this Insight
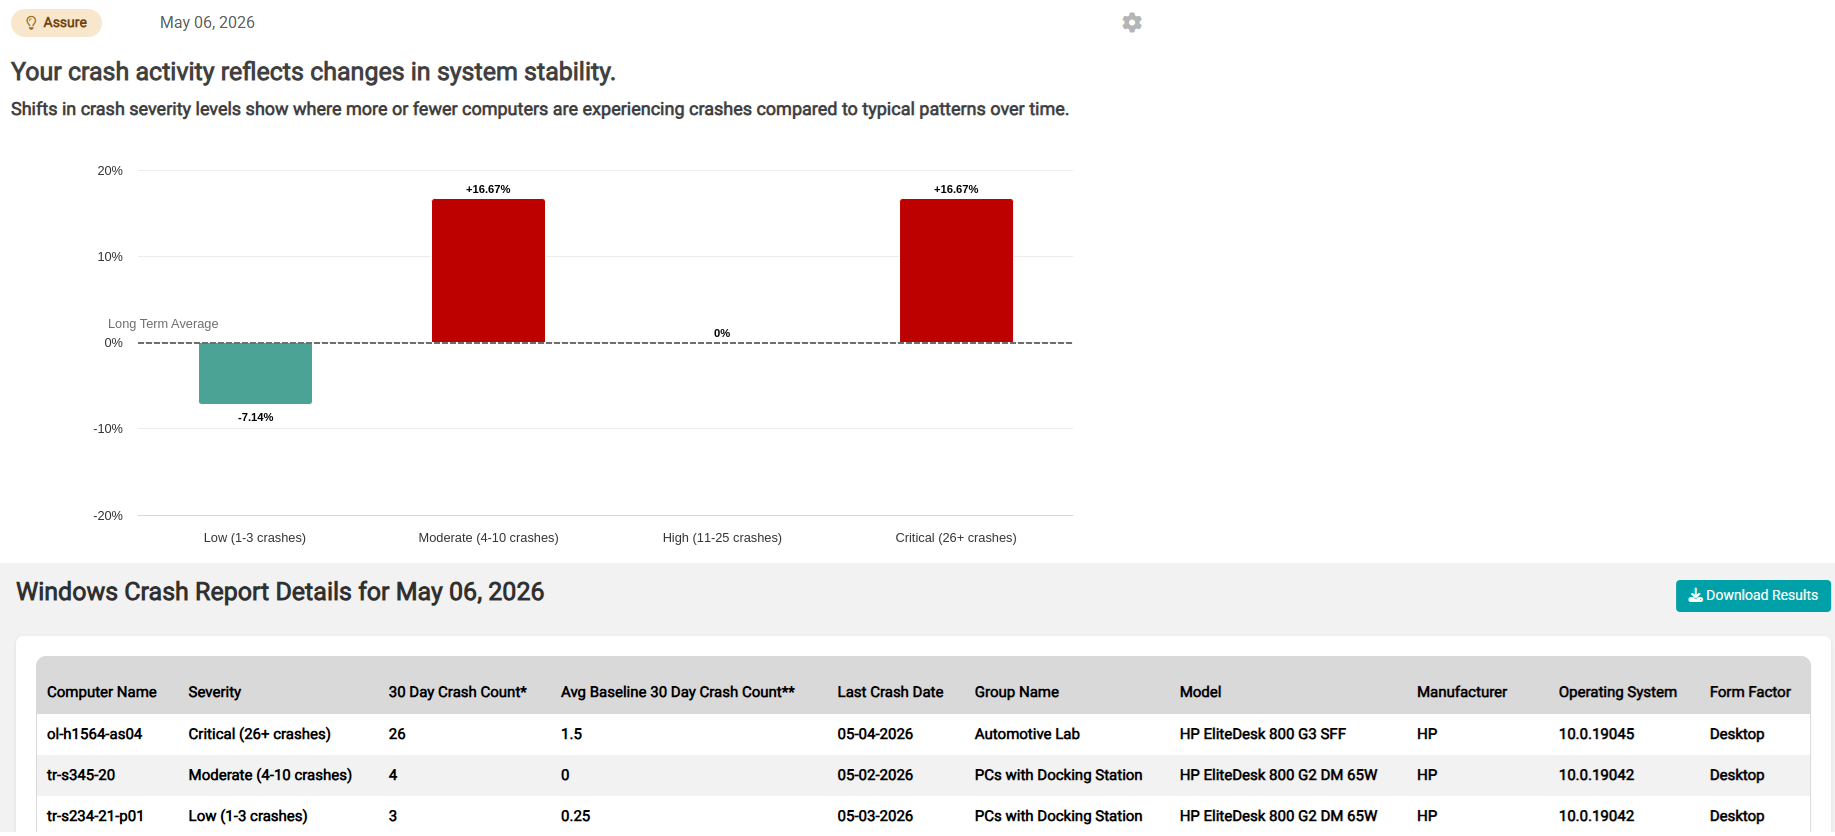
The graph directly on the Insights page shows the overall trend of computer crashes over the previous month (default) against up to a full year of data being used as the baseline average. Looking at this graph, you will be able to see if you are experiencing more or fewer crashes within each specified grouping: low, moderate, high, and critical. The above example shows fewer computers in the last month with a low amount of crashes, while there are more computers with a moderate or critical amount of crashes. It’s important to note that, while the High column is showing a zero percent value, that doesn’t mean there are no computers in that category. It instead means that there has been no change in the number of computers that are crashing at that level of frequency compared to our one year average.
Beyond the graph, clicking the View My Crash Report Details button will give you a list of all computers that had a crash last month, even if a particular grouping shows 0% change. This way you can investigate individual computers, see patterns or makes/models that may be experiencing similar issues, or even determine if computers need reimaged/replaced.
Configuration Settings (Requires Assure license to configure)
- Email Notification Frequency
- Default – Monthly
- Options – Weekly, quarterly, and yearly
- Group and Computer exclusions
- Default – No computers excluded
- Options – Specifying specific groups within LabStats or specific computer hostnames to exclude
Navigation to the Alerts & Insights settings is quick and easy:
- Option 1 – Click on the gear at the top right of the alert.
- Option 2 – From within LabStats: Admin > Settings > Insights & Alerts Settings > Click on
the carrot next to ‘Email Notification’. - To turn email notifications off, click the toggle next to “Email Notification”.
Note: Alert graphics are updated at the frequency set by individual users. The last refresh date is shown above each alert graphic (see above).