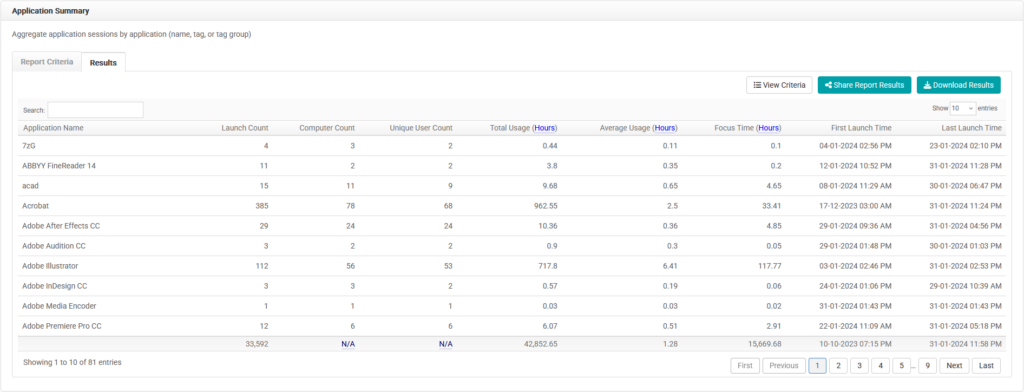
The Application Summary report displays an aggregated list of application sessions grouped by application, tag, or tag group. This provides a list of all tracked applications. Report results include the application name, launch count, computer count, unique user count, total usage (days, hours, or minutes), average usage (days, hours, or minutes), focus time (days, hours, or minutes), first launch time, and last launch time.
You can limit report criteria to a specific date range, and filter computers by name, operating system, tag, and group. You can also filter users by an application name or tag(s) and include all applications or only those containing certain tags. Display grouping can be selected by application name, application tag, and application tag group.
What this report can help you solve
The Application Summary is a high-level overview of application usage. It shows the number of launches, usage time, focus time, and a few other data points.
It’s great for looking at reports in context of one another, or even to just get a high-level idea of how much an app has been interacted with over a period of time.
This report can help you see the software that is used the most, as well as the least, in your environment. If you have multiple options for similar software (such as Photoshop and GIMP) you can also compare to see which software is being utilized more, which may affect future deployment or purchasing decisions.
Run an Application Summary Report
The report criteria page will load and include a date range and various ways to filter the report. Selecting and adding tags and groups to the report criteria will help to further segment the data and show meaningful results.
- Navigate to BI Reports. Then click Application Summary.
- Select the date range. Select the appropriate Schedule option (Apply assigned schedules if schedules have been assigned to each group, or Apply a single schedule).
- Click Including all computers. Select computers, groups, or tags to include. Click Close.
- Click Including all users. Select usernames or tags to include. Click Close.
- Click Group by application name to select how the results are grouped.
- Click Submit.
The results can be filtered further using the search option. Options to View Criteria, Share Report Results, or Download Results are available.
- Selecting the Share Report Results option will load a form.
- Enter the recipient’s email address in the To field, change the default Subject field if necessary, use the Message field to add a personalized message, and choose to send the report in Friendly or Raw format.
- Selecting the Download Results option gives a choice to download the results in Friendly or Raw format.
- Raw results lack formatting to make further manipulation of the data easy.
- Friendly results are formatted for professional presentation of the data.
Have questions? Contact support@labstats.com.


