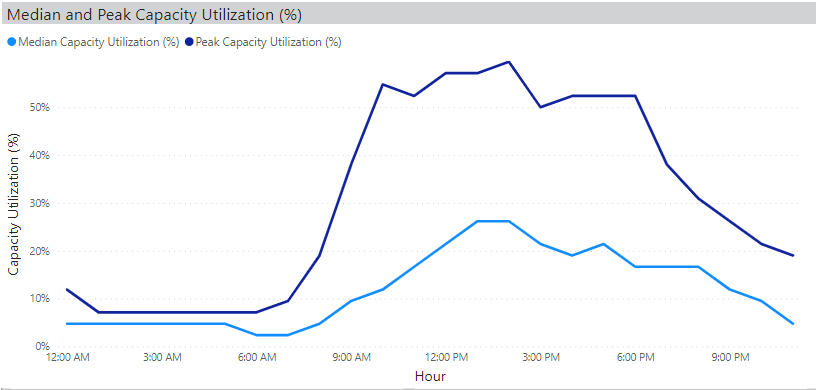
Key Benefit: Optimize your lab hours based on usage to give students the resources they need while not overspending on open labs when they’re not being used.
Understanding when your students are using on campus computer labs allows you to cover their support needs without overstaffing.
Related: How to Open the Hardware Usage Power BI Template
How to identify when students are using labs:
- Open the Hardware Usage Template
- Open the Are My Labs Open at the Right Hours tab
- Use the Group (Hierarchy) slicer to isolate the lab or group of labs you want to analyze

- Observe the Peak Capacity Utilization % to determine when students are using the lab.
- Adjust your lab staff to accommodate those needs.
Considerations:
Lab demand changes depending on the time of day, day of week, and time of the year.LabStats Power BI Reports allow you to filter your data to accommodate for those changes. For example; you may want to get an accurate view of lab use on the weekends. You can filter results for the weekend hours by isolating those days in the Days of the Week slicer. Also, maybe your lab attendance fluctuates depending on the time of year. You may want to consider restricting your data to the date range of a semester to filter out break time.
Sample Scenario:
You look at the Peak Capacity Utilization % for the library computer lab and you notice that there is a steep increase in usage right when the lab opens. This means students would likely use the lab more if it were open earlier in the morning. Consider opening this lab earlier to remove some of the pressure the lab gets when it opens. This is an easy way to enhance the student’s experience on campus.


