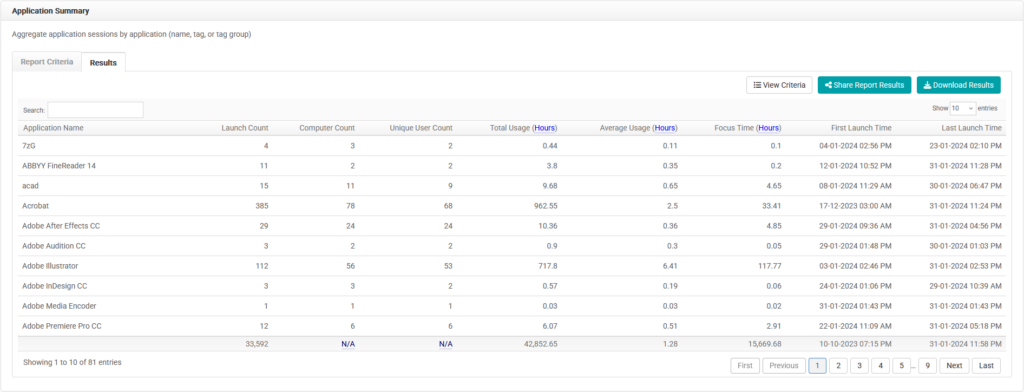
LabStats’ reports show which applications are being used. Compare the usage of multiple applications or application groups (application tags). Easily decide which applications get the most/least amount of use.
Use the Application Summary report to view all of the application usage for a specific group (lab). This data, in conjunction with the Application Launch History report, can help to identify software that rarely or always gets used.
Run an Application Summary Report
Running this report, with the following chart criteria, will show the different tracked applications in the selected group(s). Pair this information with application usage data to see if all of the installed applications are being used.
- Navigate to Reports. Then click the Application Summary report.
- Select the date range.
- Click Including all Computers. Select group(s) (lab). Click Close.
- Click All applications. Select the application(s) or application tag(s). Click Close.
- Click Submit.


