LabStats’ reports show how many students are using computer labs. LabStats allows grouping computers into separate labs. Those groups can then be reported on individually and in relationship to each other. Identify which labs need more resources and which could be scaled down.
The Login Summary by Group report shows combined user usage data from the selected date range, whereas the User History report and the Login History report show the usage data broken out by day. The User History report shows only unique users and the Login History report shows all logins.
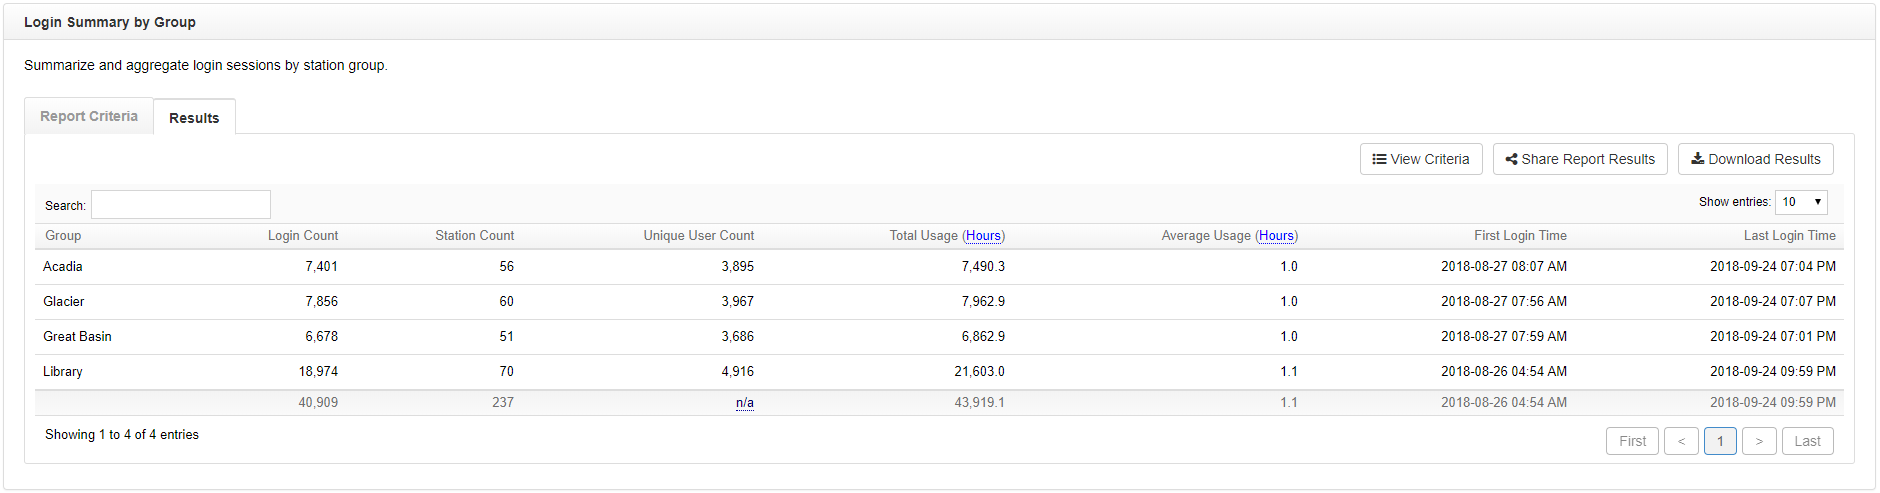
Run a Login Summary by Group Report
Running this report, with the following report criteria, will show usage statistics for every group (lab). See if some labs are getting more/less usage. Also, pinpoint the differences between unique users and repeat users. This report can be further segmented with the use of user tags (field of study, year in school, etc.).
- Navigate to Reports. Then click the Login Summary by Group report.
- Select the date range.
- Click Submit.
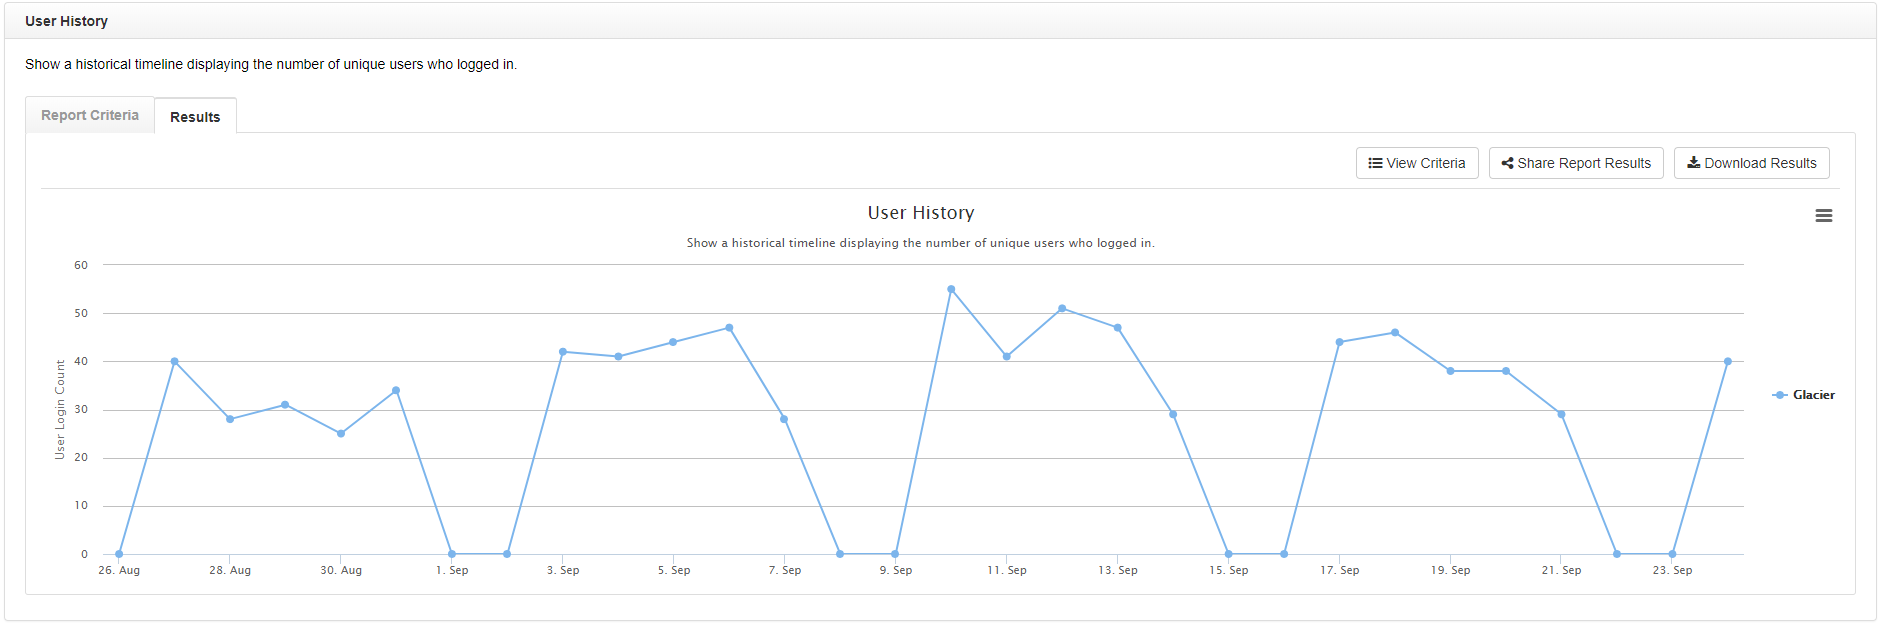
Run a User History Report
Running this report, with the following report criteria, will show unique user usage statistics for every group (lab). See if some labs are getting more/less usage and if certain days get more use than others.
- Navigate to Reports. Then click the User History report.
- Select the date range.
- Click Submit.
Run a Login History Report
Running this report, with the following report criteria, will show all login usage statistics for every group (lab). See if some labs are getting more/less usage and if certain days get more use than others.
- Navigate to Reports. Then click the Login History report.
- Select the date range.
- Click Submit.