LabStats’ reports show the busiest days and times for computer labs. Use this data to help inform when labs should open and close, and also when you need more or fewer staff on hand. See if the lab schedule and staffing could be optimized to get the most out of university resources.
The Peak Usage History report in LabStats shows the number of computers in-use at the usage peak. If a lab is consistently at or near peak usage daily, then more resources might need to be allocated to the lab, or students might need to be redirected to less-used labs. Conversely, if a lab is consistently below max capacity, resources might be better used elsewhere.
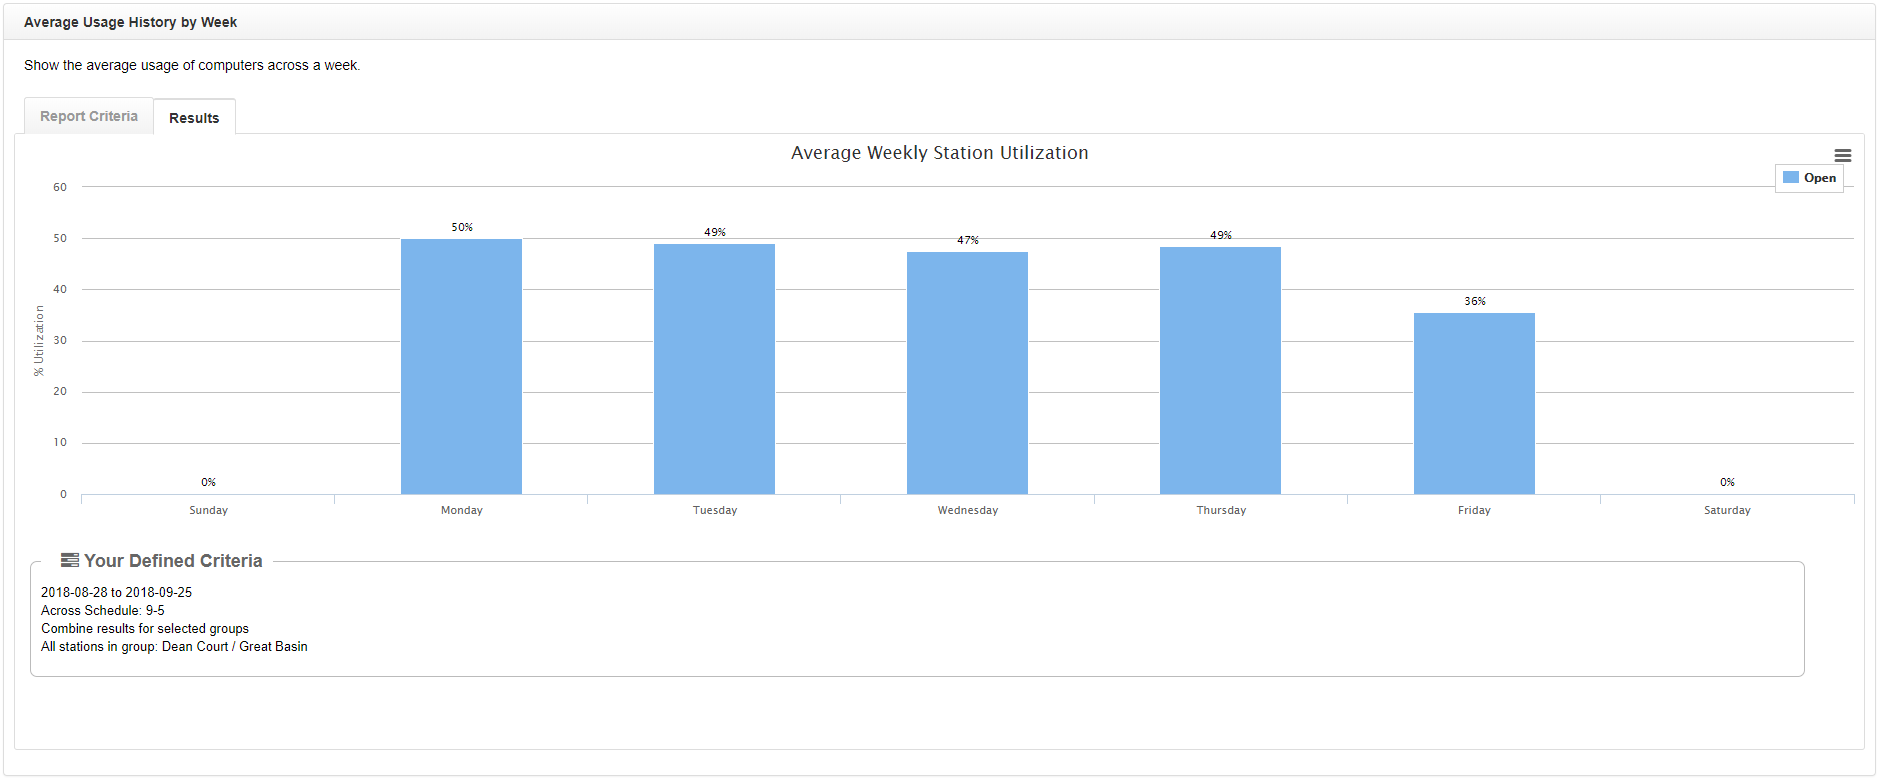
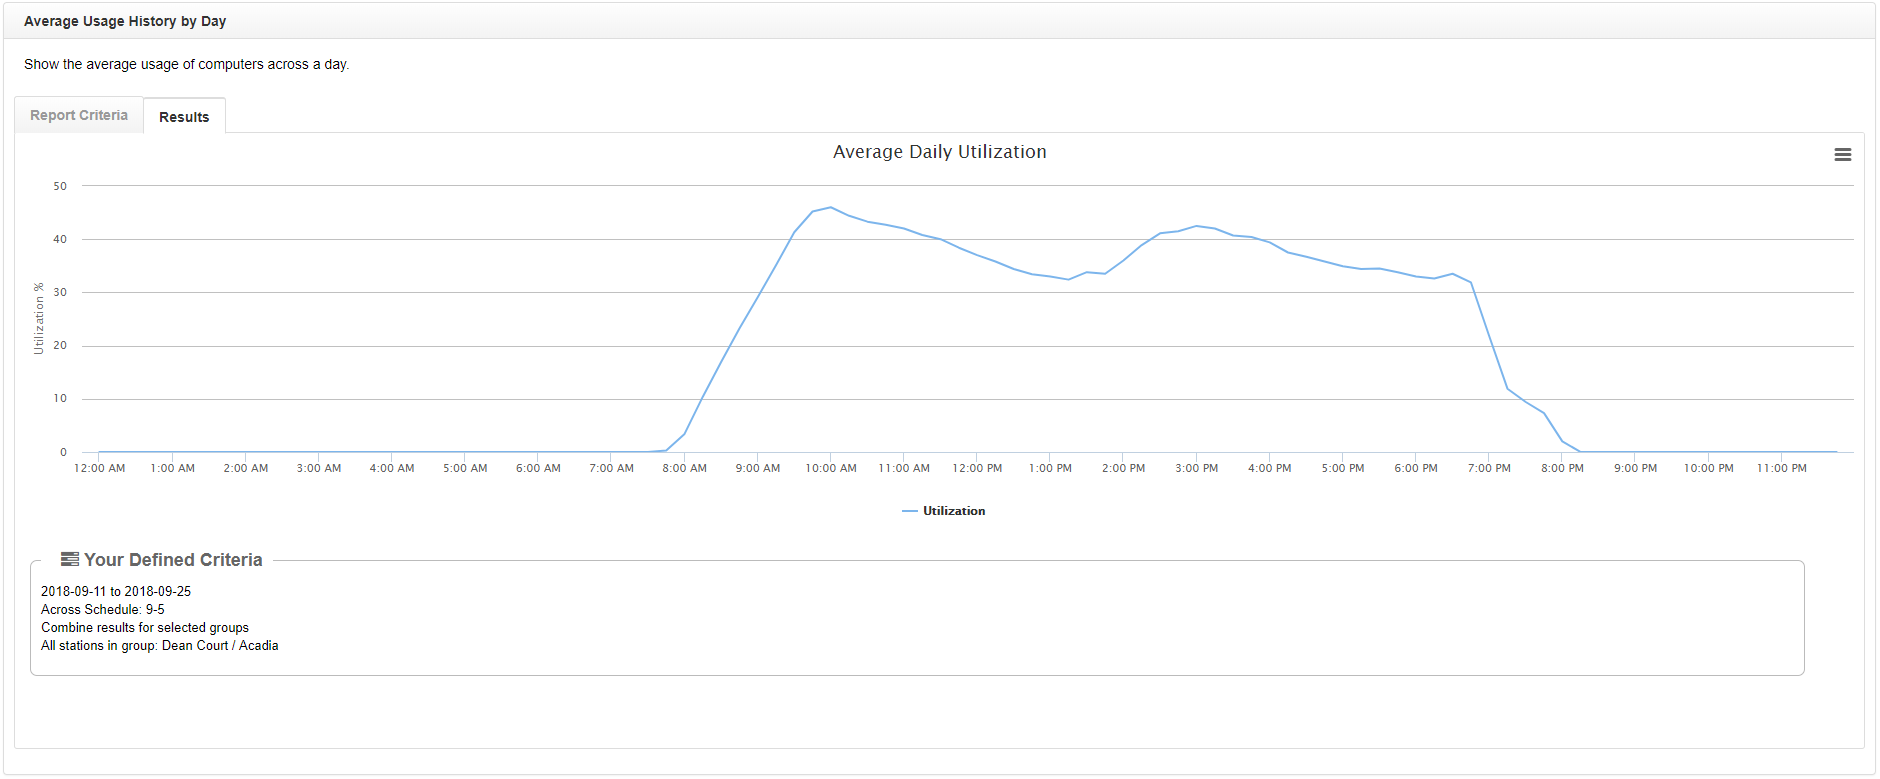
Use the busiest days highlighted in the Average Usage History by Week report, or the Peak Usage History report, to run the Average Usage History by Day report in order to find the busiest times on the busiest days. This can be repeated to show the least busy days and times, which is integral to creating an optimal lab schedule.
Run a Peak Usage History Report
Running this report, with the following chart criteria, will show the peak usage of each selected group (lab). See which have the highest average peak usage through the selected date range, and easily identify how often labs are used.
- Navigate to Reports. Then click the Peak Usage History report.
- Select the date range.
- Click Including all Stations. Select groups (labs) to include. Click Close.
- Click Combine results for selected groups
- Select Separate results by group. Click Close.
- Click Submit.
Run an Average Usage History by Week Report
Running this report, with the following chart criteria, will show the average utilization for the day for the selected group (lab). See which days have the highest average utilization through the selected date range, and easily identify usage trends.
- Navigate to Reports. Then click the Average Usage History by Week report.
- Select the date range.
- Click Including all Stations. Select the group (lab). Click Close.
- Click Submit.
Average Usage History by Day Report
Running this report, with the following chart criteria, will show lab usage on the selected day in increments of fifteen minutes.
- Navigate to Reports. Then click the Peak Usage History report.
- Select the date range.
- Click Including all Stations. Select groups (labs) to include. Click Close.
- Click Combine results for selected groups
- Select Separate results by group. Click Close.
- Click Submit.


