New Automated Insight
The new Windows Crash Reports insight helps you monitor Windows fatal crashes across your environment. It highlights affected computers and changes in crash frequency so teams can spot escalating stability issues such as hardware degradation, driver conflicts, software instability, or configuration inconsistencies and take action before disruptions become widespread.

What is a crash?
LabStats defines a crash as a collection of system events that led up to the computer unexpectantly shutting down or otherwise restarting, such as a blue screen or loss of power. This insight specifically looks at the System Event Viewer log for Critical events with the following IDs: 1, 18, 41, 86, 88, 1001, 6008.
Information contained in this Insight
The graph directly on the Insights page shows the overall trend of computer crashes over the previous month (default) against up to a full year of data being used as the baseline average. Looking at this graph, you will be able to see if you are experiencing more or fewer crashes within each specified grouping: low, moderate, high, and critical. The above example shows fewer computers in the last month with a low amount of crashes, while there are more computers with a moderate or critical amount of crashes. It’s important to note that, while the High column is showing a zero percent value, that doesn’t mean there are no computers in that category. It instead means that there has been no change in the number of computers that are crashing at that level of frequency compared to our one year average.
Beyond the graph, clicking the View My Crash Report Details button will give you a list of all computers that had a crash last month, even if a particular grouping shows 0% change. This way you can investigate individual computers, see patterns or makes/models that may be experiencing similar issues, or even determine if computers need reimaged/replaced.
Configuration Settings (Requires Assure license to configure)
- Email Notification Frequency
- Default – Monthly
- Options – Weekly, quarterly, and yearly
- Group and Computer exclusions
- Default – No computers excluded
- Options – Specifying specific groups within LabStats or specific computer hostnames to exclude
Navigation to the Alerts & Insights settings is quick and easy:
- Option 1 – Click on the gear at the top right of the alert.
- Option 2 – From within LabStats: Admin > Settings > Insights & Alerts Settings > Click on
the carrot next to ‘Email Notification’. - To turn email notifications off, click the toggle next to “Email Notification”.
Note: Alert graphics are updated at the frequency set by individual users. The last refresh date is shown above each alert graphic (see above).
New spreadsheet upload for bulk moving computers
LabStats has released a new feature to help organize your computers and their historical data. The Group Assignments Spreadsheet Upload allows you to quickly reorganize your computers in bulk, even across multiple groups, while assigning a date that those computers physically moved there for data accuracy. This tool is located in your LabStats portal under Admin > Custom Data Imports.
When opening this tool, you might notice a warning page that you have duplicate group names. In order to improve performance and data accuracy within LabStats, our goal is to move towards having every single group name be unique, not just their group path. Rather than an immediate change; this new spreadsheet upload is the first step towards that goal with a slow rollout everywhere else, hopefully reducing the amount of impact any inconveniences this change will cause. Note that changing the group names will not have any effect on the collected data.

Requires unique group names
If you have group names that are not unique, when browsing to this page it will display all the groups that have shared names so they can be easily changed. This includes the parent groups that would just include subgroups. For example, if you had Building A > Group 1 > Lab 123 and Building B > Group 1 > Lab 456, it would display both these groups since there would be two paths that had a group called “Group 1”. Once those were renamed to be unique, then you would be able to utilize this tool.
New Automatic Insight
The Old Operating Systems Insight is similar to the Windows 11 compatibility insight but this one covers all operating systems and their respective versions that are either already past End of Life (EoL) or approaching their EoL. This includes looking at Windows build numbers so you can verify that you aren’t running older versions of Windows 11 that are no longer be receiving any updates from Microsoft.

Configuration Settings (Requires Assure license to configure)
- Email Notification Frequency
- Default – Monthly
- Options – Weekly, quarterly, and yearly
- Length of time until EoL date
- Default – 1 year
- Options – 1 week, 1 month, 2 months, 3 months, and 6 months
Navigation to the Alerts & Insights settings is quick and easy:
- Option 1 – Click on the gear at the top right of the alert.
- Option 2 – From within LabStats: Admin > Settings > Insights & Alerts Settings > Click on
the carrot next to ‘Email Notification’. - To turn email notifications off, click the toggle next to “Email Notification”.
Note: Alert graphics are updated at the frequency set by individual users. The last refresh date is shown above each alert graphic (see above).
Recommended Actions Example
- Upgrade or reimage computers as necessary so that all operating systems are currently being supported by their manufacturers. This ensures you are always receiving the latest updates from them.Au
New Automatic Insight
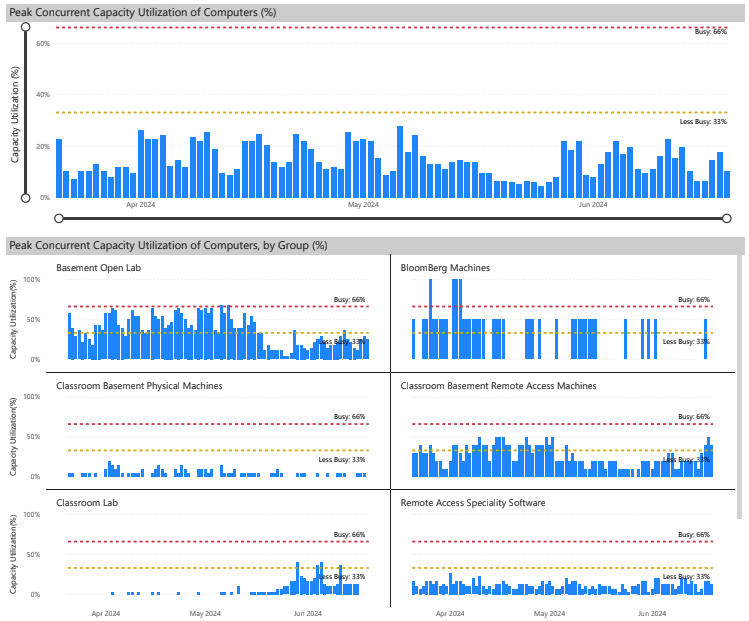
The Zero Logins insight is similar to the Inactive Computers Insight but instead this one shows computers that are actively checking in but no one is logging into them. This gives you immediate visibility into computers that are powered on and otherwise functioning correctly but are not being used. This insight helps spot unused hardware, understand utilization gaps, and take action to improve resource efficiency.

Configuration Settings (Requires Optimize or Assure license to configure)
- Email Notification Frequency
- Default – Weekly
- Options – Monthly, quarterly, and yearly
- Unused computer length of time
- Default – 1 month
- Options – 1 week, 2 months, 3 months, 6 months, and 1 year
Navigation to the Alerts & Insights settings is quick and easy:
- Option 1 – Click on the gear at the top right of the alert.
- Option 2 – From within LabStats: Admin > Settings > Insights & Alerts Settings > Click on
the carrot next to ‘Email Notification’. - To turn email notifications off, click the toggle next to “Email Notification”.
Note: Alert graphics are updated at the frequency set by individual users. The last refresh date is shown above each alert graphic (see above).
Recommended Actions Example
- Determine why these computers are going unused. Is it a location issue or is the hardware outdated? Do users not even know these computers are available to them? Investigating that reasoning allows you to make decisions on how best to utilize these computersOptimize
New Automatic Insight
The Low Storage Space insight will allow you to set a threshold for storage space and then provide alerts when computers are exceeding that value. Computers with low storage space can experience performance issues or even crashing, so being able to monitor computers that are reaching your determined limits allows you to better maintain your computers.

Configuration Settings (Requires Assure license to configure)
- Email Notification Frequency
- Default – Weekly
- Options – Monthly, quarterly, and yearly
- Storage threshold
- Default – 80%
- Options – 50% – 90% at 5% intervals
Navigation to the Alerts & Insights settings is quick and easy:
- Option 1 – Click on the gear at the top right of the alert.
- Option 2 – From within LabStats: Admin > Settings > Insights & Alerts Settings > Click on
the carrot next to ‘Email Notification’. - To turn email notifications off, click the toggle next to “Email Notification”.
Note: Alert graphics are updated at the frequency set by individual users. The last refresh date is shown above each alert graphic (see above).
Recommended Actions Examples
- Upgrade storage space on these computers so they are no longer passing your specified limits
- Using reports within LabStats you could show which pieces of installed software on these computers are not being used, then those applications could be uninstalled to free up space.As
New Automatic Insight
The Windows 11 Compatibility Insight identifies computers running outdated or unsupported versions of Windows and shows which ones can, might, or can’t be upgraded. This list can be exported to view the full list of at-risk computers, review TPM and processor compatibility, and take action before Microsoft’s support deadlines hit on October 14th. When exporting the list of computers, it will display the reasoning for computers that cannot be upgraded. For computers that can possibly be upgraded, that generally means the LabStats client needs to be upgraded on that computer so it can gather TPM data.

Configuration Settings (Requires Optimize or Assure license to configure)
- Email Notification Frequency
- Default – Monthly
- Options – Quarterly and yearly
Navigation to the Alerts & Insights settings is quick and easy:
- Option 1 – Click on the gear at the top right of the alert.
- Option 2 – From within LabStats: Admin > Settings > Insights & Alerts Settings > Click on
the carrot next to ‘Email Notification’. - To turn email notifications off, click the toggle next to “Email Notification”.
Note: Alert graphics are updated at the frequency set by individual users. The last refresh date is shown above each alert graphic (see above).
Recommended Actions Examples
- Upgrade Windows 10 computers that are able to be upgraded so that you are running Microsoft supported operating systems in your environment.
- For computers that are unable to be updated, having the data on which computers and where they are located allows you to make informed decisions on what to do with those going forward.
New Automatic Insight
This new homepage insight shows computers in your LabStats instance that have not been assigned to a group. The Unassigned Computer Alert makes it easy to find and assign computers to keep data clean and reports accurate. Computers that are unassigned will not show up in any group based reports which means those reports could be missing valuable data!

Configurable Settings
- Email Notification Frequency
- Default – Weekly
- Options – Daily, monthly, quarterly and yearly
Navigation to the Alerts & Insights settings is quick and easy:
- Option 1 – Click on the gear
at the top right of the alert. Select the setting you want to configure. - Option 2 – From within LabStats: Admin > Settings > Insights & Alerts Settings > Click on
the carrot next to ‘Email Notification’. - To turn email notifications off, click the toggle next to “Email Notification”.
Note: Alert graphics are updated at the frequency set by individual users. The last refresh date is shown above each alert graphic (see above).
Recommended Actions Examples
- Assign computers to their respective groups
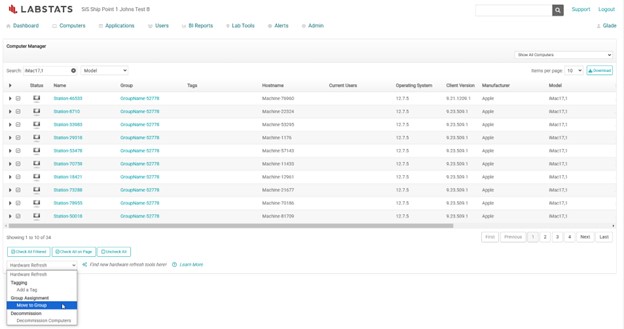
- If a computer has been in multiple groups you can build its group history. Simply start by moving it into the first group it was in with the appropriate move date. Then move it again into the next group using the date it physically moved into that group to make sure the data is placed in the correct locations.
New Value Feed
This new LabStats homepage feature keeps important insights front and center, making it easy for you to take action and see results! This is the new home for the release of new time-saving alerts, insights, and automated reports. An example of the value feed based on the new inactive computers alert data is shown below.

Inactive Computers Alert
The Inactive Computer Alert is now on the LabStats portal homepage and coming to your email inbox (configurable). Inactive Computer Alert is the first of many new insights that will be provided by your LabStats subscription.
The LabStats client reports every time a computer is powered on and connected to the internet. Inactive computers are defined as either offline, unpowered, or those from which the client has been removed.
You will be notified when computers haven’t reported to LabStats in 7 days or longer (configurable – see below). Most frequently, these computers are no longer part of the institution’s inventory and should be decommissioned in LabStats. They might also be broken, without power, disconnected from the network, or possibly stolen.
Configurable Settings
- Check-in Interval – The time interval after which the system recognizes computers as inactive.
- Default – 1 week
- Options – 1 month, 3 months & 1 year
- Email Notification Frequency
- Default – Weekly
- Options – monthly, quarterly and yearly
Navigation to the Alerts & Insights settings is quick and easy:
- Option 1 – Click on the gear
at the top right of the alert. Select the setting you want to
configure (email notification frequency and/or inactive computer check-in interval). - Option 2 – From within LabStats: Admin > Settings > Insights & Alerts Settings > Click on
the carrot next to ‘Email Notification’. - To turn email notifications off, click the toggle next to “Email Notification”.
Note: Alert graphics are updated at the frequency set by individual users. The last refresh date is shown above each alert graphic (see above).
Recommended Actions Examples
- Decommission all computers that:
- no longer have the LabStats client installed
- you can’t find (likely 90% of all computers not seen in 365 days or more)
- Turn on all located and unused computers to verify they are functioning – if LabStats is installed, it will reappear as an ‘unassigned computer’ the next time it is powered on (with history intact)
Note: If you have a large number of unassigned computers, make sure your VMs are using VM-specific parameters (contact support if you need assistance).
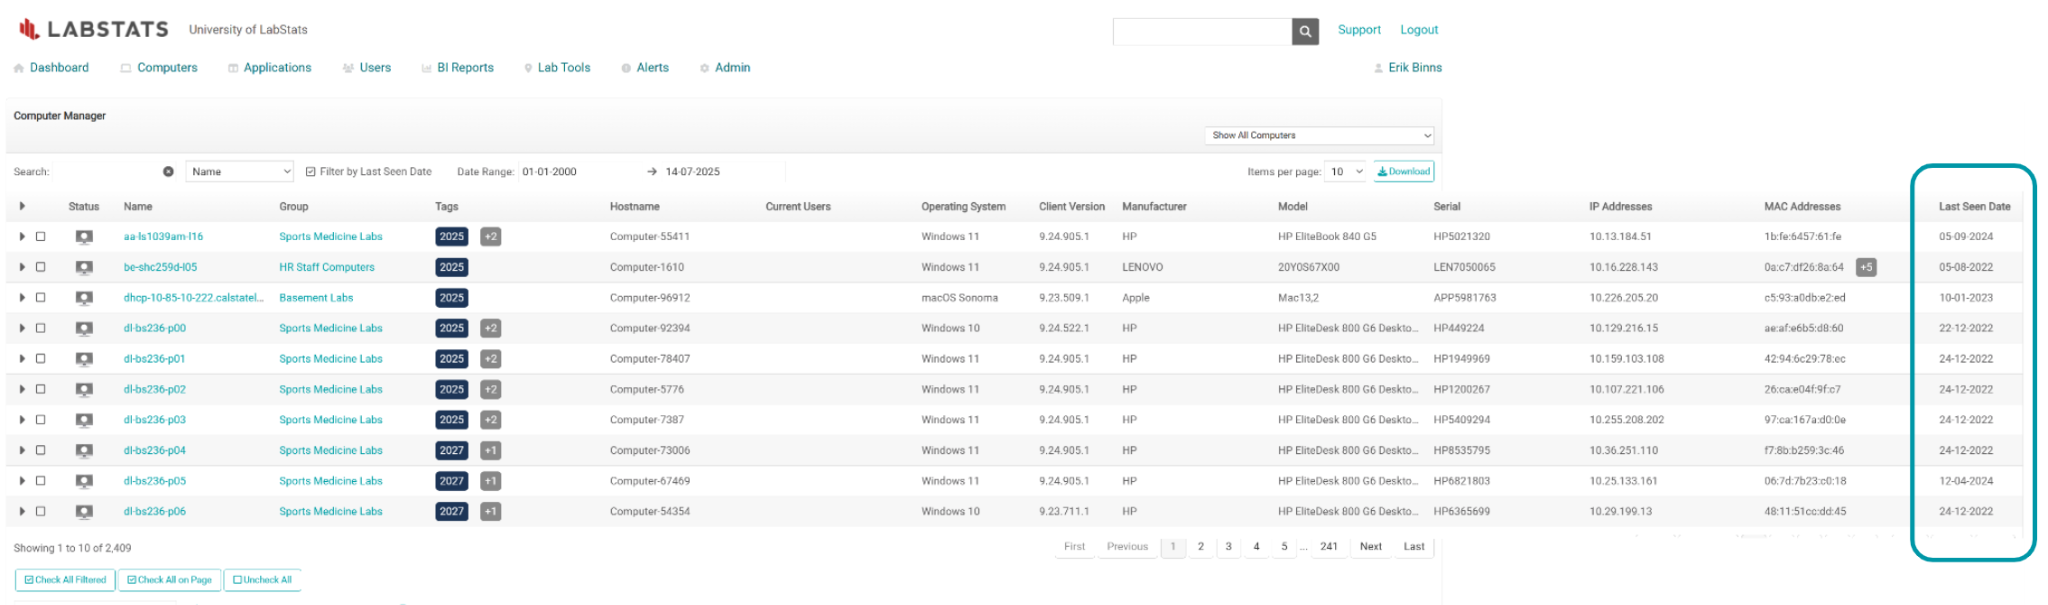
Look for the new Last Seen Date column in the Computer Manager screen! This new column shows the most recent date a computer checked into LabStats, giving you better visibility into your computer activity.
The ability to filter by Last Seen Date can help you:
- Clean up your instance quickly by decommissioning computers that have not checked in within a given time
- Identify computers that are not checking in but should be
- Identify when a problem with a computer potentially started
- Easily see when data collection for a specific computer stopped, adding report context and enhancing data verification
Currently, the Last Seen Date column is positioned to the far right of the computer manager screen, as shown below.
Hardware Refresh Enhancements
- Ensures data accuracy and maintain your LabStats data in significantly less time
- Use the most common search and filter tools in LabStats
- Single or bulk actions in 3 clicks
- Restructure computer histories as needed
Also Included in the Release
- UUID tracking
- TrackByHostname (for additional information, navigate to TrackByHostname on the Product Updates page)
- Bug fixes and security enhancements
Notes
- AD Sync functionality is no longer available with this update
- Server Version: 6.2025.0618.9 Download
For more information on the new hardware refresh process, watch the how-to video on our
LabStats Academy page.
We are excited to announce that LabStats now supports ChromeOS!
You can now track Chromebook and Chromebox usage – just like you do with Windows and macOS devices today.
This means you can:
- Monitor usage activity on ChromeOS devices
- See how & where ChromeOS devices are being used
- Track usage trends across all operating systems in one place
Use your data to:
- Focus on complete visibility across all platforms (Windows, Mac, and ChromeOS) to unify IT oversight and usage
- Lean into efficiency by controlling costs, utilize and allocate IT assets as effectively as possible, and maximize accessibility
- Extend your current Windows and Mac infrastructure monitoring to leverage Chromebooks as thin clientsReduce application sprawl and unused device costs, including ChomeOS devices without switching tools
It’s everything you already value about LabStats – extended to ChromeOS.
Current customers automatically have access to 20 FREE ChromeOS licenses through the end of established contract terms. Set it up in minutes with our lightweight Chrome extension and start making smarter decisions with full-fleet-visibility.
Schedule some time with us, or contact us at support@labstats.com to deploy and try them out!
Enhanced Tracking
The new ‘TrackByHostname’ feature allows for more precise identification of computers in virtual desktop environments, often referred to as desktop-as-a-service (DaaS) or Virtual Desktop Infrastructure (VDI).
Ideal for Dynamic and Instant Clone Environments
Effectively track cloud-hosted virtual desktops in dynamic pools and instant clone setups using their unique hostnames.
Simplified Tracking in Complex Setups
Easily identify and manage different types of devices in intricate IT environments.
Tracking for Mixed Physical and Virtual Environments
The new LabStats default algorithm tracks computers using their UUID and serial numbers, which is not always ideal for cloud based virtual machines/desktops.
The new ‘TrackByHostname’ feature enables hostname tracking on virtual computers not compatible with the default tracking methodology.
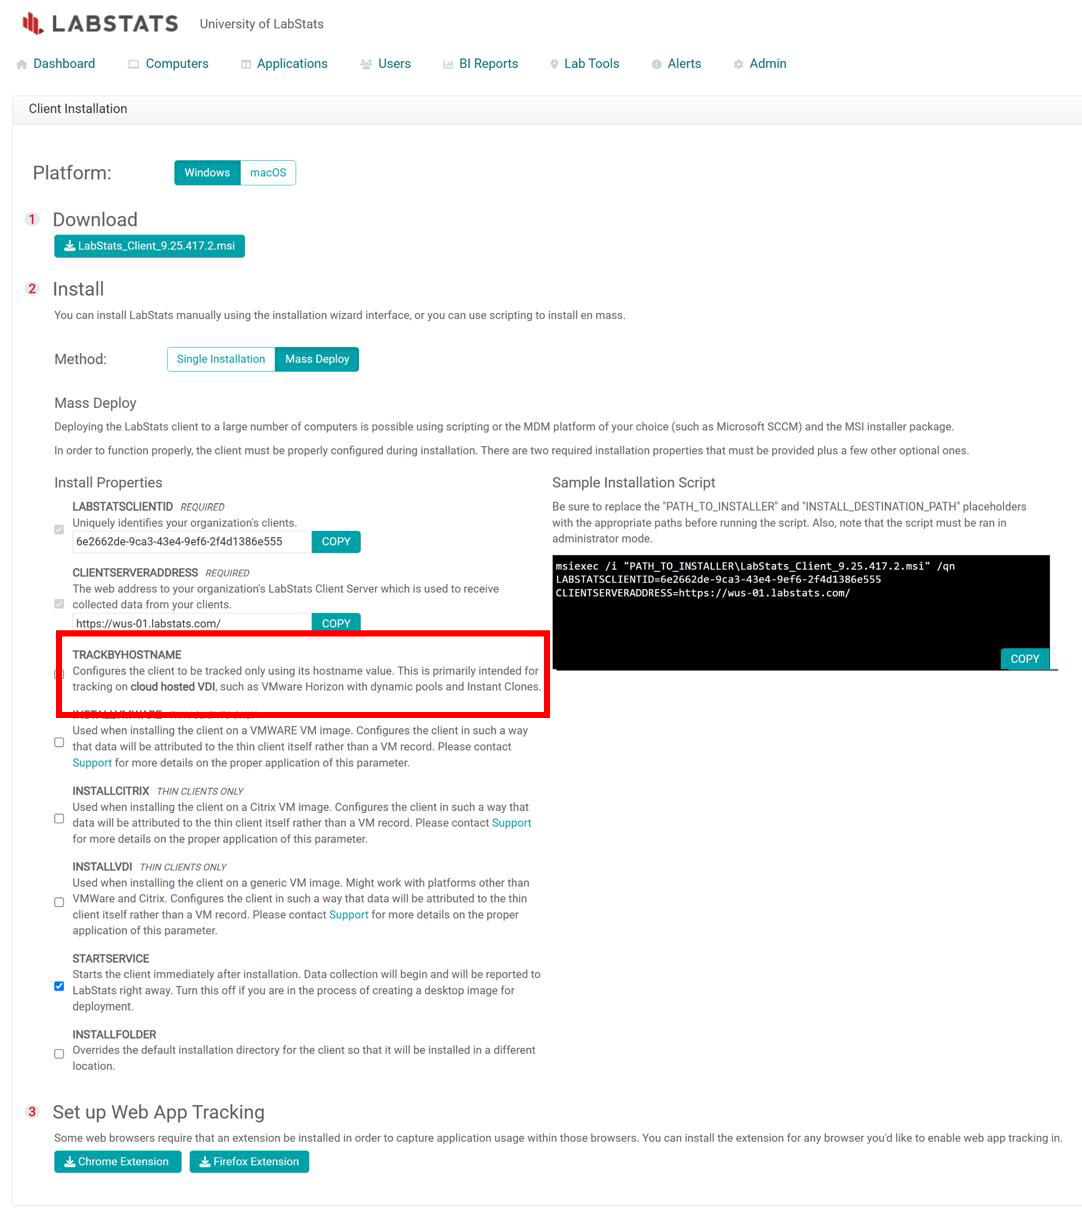
In-Portal Option Description
Path: Admin → Client Installation → Mass Deploy → TRACKBYHOSTNAME
In-Portal Description: This configures the client to be tracked only using its hostname value. This is primarily intended for tracking on cloud hosted VDI, such as VMware Horizon with dynamic pools and Instant Clones.
Hardware Refresh – Key Benefits
- Ensure data accuracy and maintain your LabStats data in significantly less time
- Use the most common search and filter tools in LabStats
- Single or bulk actions in 3 clicks
- Restructure computer histories as needed
- Organize your hardware to match your reality
Visit LabStats Academy and watch the how-to video to see it in action!
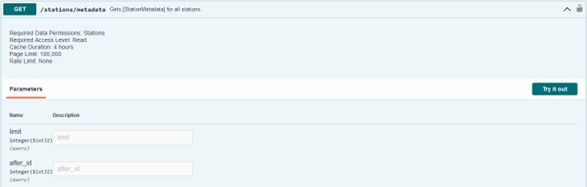
What’s New – Metadata API
- A Metadata API endpoint has been added to
api.labstats.com
Metadata attributes are collected automatically for every computer including
- Form factor, hostname, IPv4, and MAC addresses
- Graphics card description, manufacturer and model
- Hard drive capacity and availability, and physical memory
- Manufacturer and model
- Operating system, description, and version
- Processor description, manufacturer and model
IT Asset Management Benefits
- Streamlined asset management, security, maintenance, compliance reporting, and support
- Optimized upgrade planning
- Finding computers with compromised components and out-of-date OS versions
- Identifying Windows 11 compatible processors
- Quickly building metadata tag imports for usage reporting
- 20x more report data capacity
- 2x to 20x faster report processing
- These improvements have facilitated the following significant updates:
- Allowable report run time has increased 10x from 3 minutes (a typical browser limitation) to 30 minutes.
- With the expanded allowable run time, if a report needs more than 3 minutes to generate, successful report results will be emailed as an excel file.
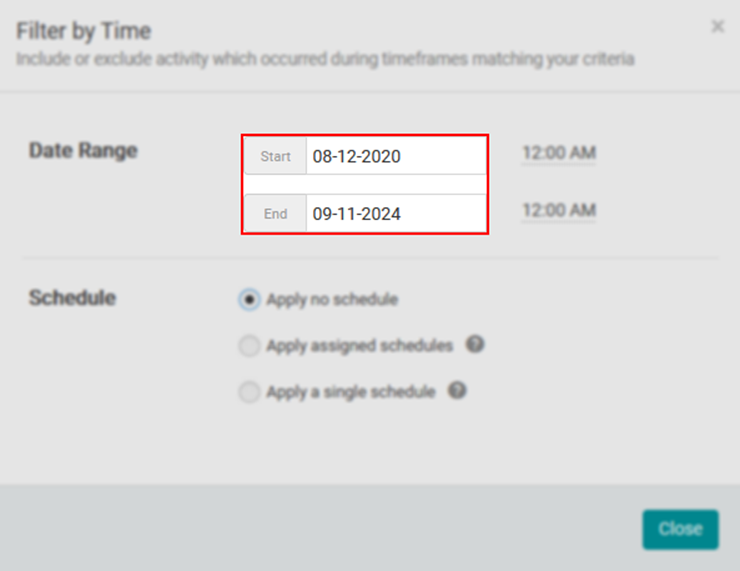
- Report date range restrictions have been eliminated
- You can pull all of your historical data into one report if you desire.
- There are still restrictions based on interval, as some reports would become illegible and others would show no visible difference.
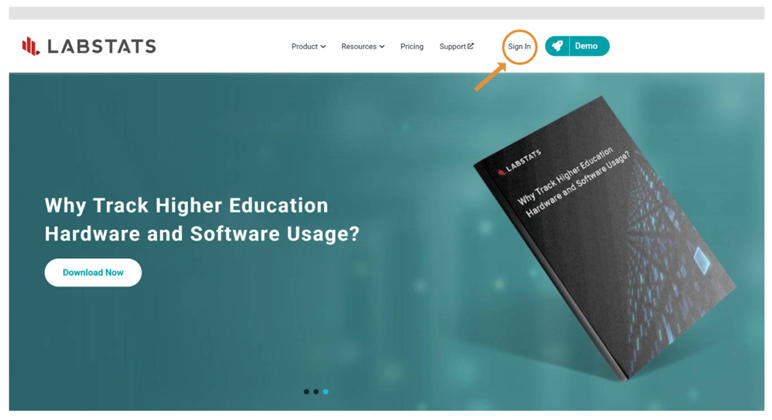
- Accessing the portal is easier and faster.
- A “Sign In” link is now present in the top ribbon of labstats.com and support.labstats.com (see graphic below), allowing cloud customers to log in to any instance, in any region, using a standard email + password sign in or single sign on (SSO).
- This new sign in option doesn’t replace the existing regional login pages, it adds a convenient alternative entry point.
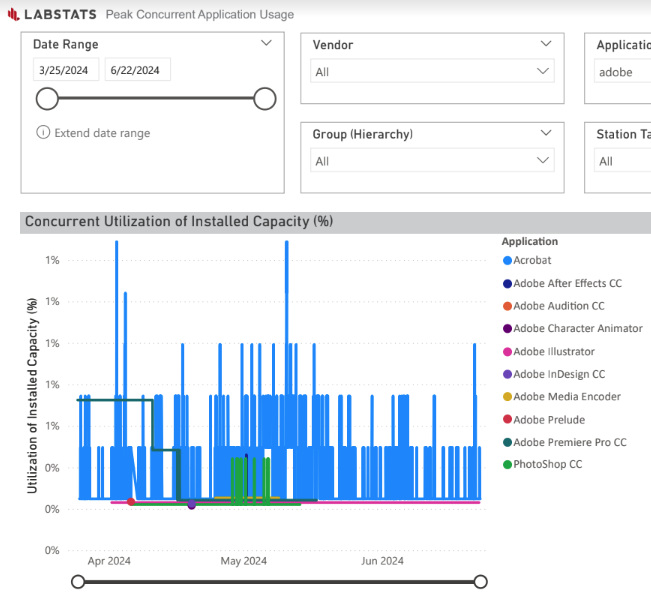
Elevate Your Data Analytics
- Elevate Your Data Analytics – Unlock the full potential of hardware
and software usage data with LabStats Direct Data Access. Seamlessly
integrate LabStats data with your preferred BI analytic tool to create
comprehensive visualizations, combining years of data to uncover
actionable insights. - Share Powerful Insights
- Generate data-rich reports and dashboards by combining LabStats
data with your other data sources and uncover what, when, why,
how, and by-whom insights about your unique IT environment. - Share information precisely the way it’s needed, with automated
reports and alerts that save time and provide answers to emergent
questions.
- Generate data-rich reports and dashboards by combining LabStats
- Power BI Dashboard Templates – Kickstart your advanced analytics with
our ready-to-use Power BI Software and Hardware Dashboard Templates.
These dashboards are a great starting point to revealing the stories
behind every device and application, supporting organization-wide
goals.Software Template
Optimize license expenditures by tracking application usage.
Hardware Template
Make informed decisions on hardware location and allocation.