LabStats’ reports show how many applications are being used. This data can be used to easily pinpoint software applications that never or rarely get used. Applications that never get used can then be removed from the image.
The Application Launch History report segmented to show max concurrent usage can show how many instances of the same applications or websites are used at peak usage. Based on the number of applications available in a lab, easily determine if there are applications that receive little or no use.
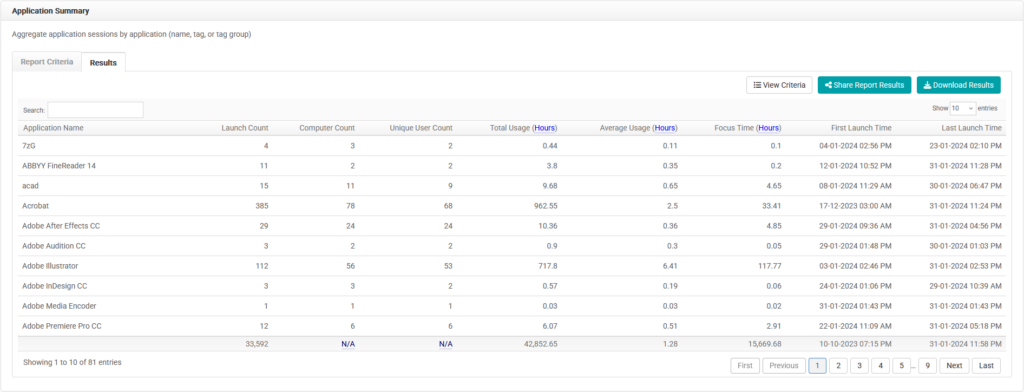
Use the Application Summary report to view all of the application usage for a specific group (lab). This data, in conjunction with the Application Launch History report, can help to identify software that rarely gets used.
The Application Dashboard can help to identify the number of uses applications have had during the last seven days. It also shows how many computers have used an application. This data can also help to identify software that rarely gets used.
Run an Application Launch History – Max Concurrent Usage Report
Running this report, with the following chart criteria, will show the peak usage of the selected software applications for the selected group (lab). See if the application is near peak usage and easily determine if it can be removed from the image.
- Navigate to Reports. Then click the Application Launch History report.
- Select the date range.
- Click Including all Computers. Select the group (lab). Click Close.
- Click All applications. Select the application(s) or application tag(s). Click Close.
- Click Submit.
- Scroll down to the graph showing max concurrent usage.
Run an Application Summary Report
Running this report, with the following chart criteria, will show the different applications installed in the selected group(s). Pair this information with application usage data to see if all of the installed applications are being used.
- Navigate to Reports. Then click the Application Summary report.
- Select the date range.
- Click Including all Computers. Select group(s) (lab). Click Close.
- Click All applications. Select the application(s) or application tag(s). Click Close.
- Click Submit.
View the Application Dashboard
Use the Application Dashboard to pinpoint the number of computers that use certain applications.
- Navigate to Applications. Then click Dashboard.
- Search for a specific application.
- Change the number of showed entries.
- Order by specific column when clicked.


